

Forecasting the coronavirus pandemic
Forecasting the coronavirus pandemic
Fear, uncertainty and doubt - a user's guide

I half-wrote a piece on forecasting the coronavirus pandemic the prior weekend - by this weekend it was completely out of date. That’s the nature of things in fast-moving crises. I wanted to write a shorter note this week on how people are actually trying to forecast and plan for this pandemic, and what it teaches us about forecasting.
The key thing to remember is that in any forecast or summary story you read - either about the virus or the economic impact - the true level of uncertainty is far higher than what is acknowledged. It encapsulates the big division in forecasting between “statistical uncertainty” which can be modeled and “fundamental uncertainty” which cannot.
Simulating trends and outcomes
On March 16, 2020 (aka a million years ago), a team from Imperial College in the UK put together a forecast that scared the shit out of policymakers in the US and UK [Imperial College]. They predicted that a ‘mitigation’ strategy would lead to hundreds of thousands or millions of death in the US and UK and recommended a ‘suppression’ strategy of basically hunkering down until the virus is gone or vaccines are developed and deployed in the field (which could take up to 18 months). This paper was widely circulated and was one of the key inputs in the decision to start taking aggressive actions in both countries - lockdowns at the state level, closing non-essential businesses, and so on.
The method that they use is quite interesting - it’s an “individual-based simulation model”. The paper cited here is light on methodological detail, as presumably the authors have more important things on their mind. However, the references link to a much more detailed prior paper with the same lead author, Neill Ferguson [PNAS]. Basically, they create a little world in their computer - they create little simulated ‘agents’ who go about their business mixing in schools, workplaces, grocery stores, etc. They drop a virus into it, which can spread in this virtual environment depending on the parameters they set for the virus. For example, a virus that spreads easily while people are asymptomatic will spread faster - otherwise spread will be contained by our sick little computer agents stay in their simulated houses. They then simulate the effects of various interventions - school closures, workplace closures, etc.
The biggest inputs here are the parameters of the virus itself. The most important one is a measure of transmissibility, R0 (pronounced ‘R-naught’), but there are actually a lot of parameters. There is the incubation period (longer is worse), how much asymptomatic individuals spread the disease, and so on. There’s also the key assumption that recovered patients have immunity - normally the case for most diseases, hopefully also true for Covid-19.
They forecast fatality not purely as a measure of how ‘serious’ the virus is, but of how well the medical system is able to cope. It’s clearly much more serious for the elderly than the young, but proper medical care is able to do a lot. The case fatality rate for the 1918 Spanish Flu appears to have been about 6-8% [Wired], much higher than the 2-3% seen so far for Covid-19. This is most likely in large part due to modern medical care, which can do a lot with ventilators and intensive supervision. Unfortunately, one implication of the Imperial College analysis is that as hospitals get overwhelmed then the quality of care will drop dramatically and death rates will explode.
These factors can be approximated and estimated with margins of errors and neat statistical bounds - what can’t be measured is what’s driving the underlying trend.
What lives in the scary space beyond the trendline
The key passage is early on:
In addition, the impact of many of the NPIs [NB: non-pharmaceutical interventions] detailed here depends critically on how people respond to their introduction, which is highly likely to vary between countries and even communities. Last, it is highly likely that there would be significant spontaneous changes in population behaviour even in the absence of government-mandated interventions.
A key underlying assumption in all of these models is compliance - they assume that the little agents in the machine act the way they are told. You can model the effect of non-compliance, of course - assume some fraction of the little agents decide to disobey. I’m no epidemiologist but I will venture a guess that it’s bad when the agents decide to choose their own adventures.
What you cannot model is the underlying political factors that drive what policy choices are made. For example, are elected leaders hesitant to impose travel restrictions because of pressure from donors or constituents? Will they stop before shutting down businesses because they fear widespread defiance? Will contradictory messages from politicians, faith leaders, and the media create a morass of half-measures and confusion?
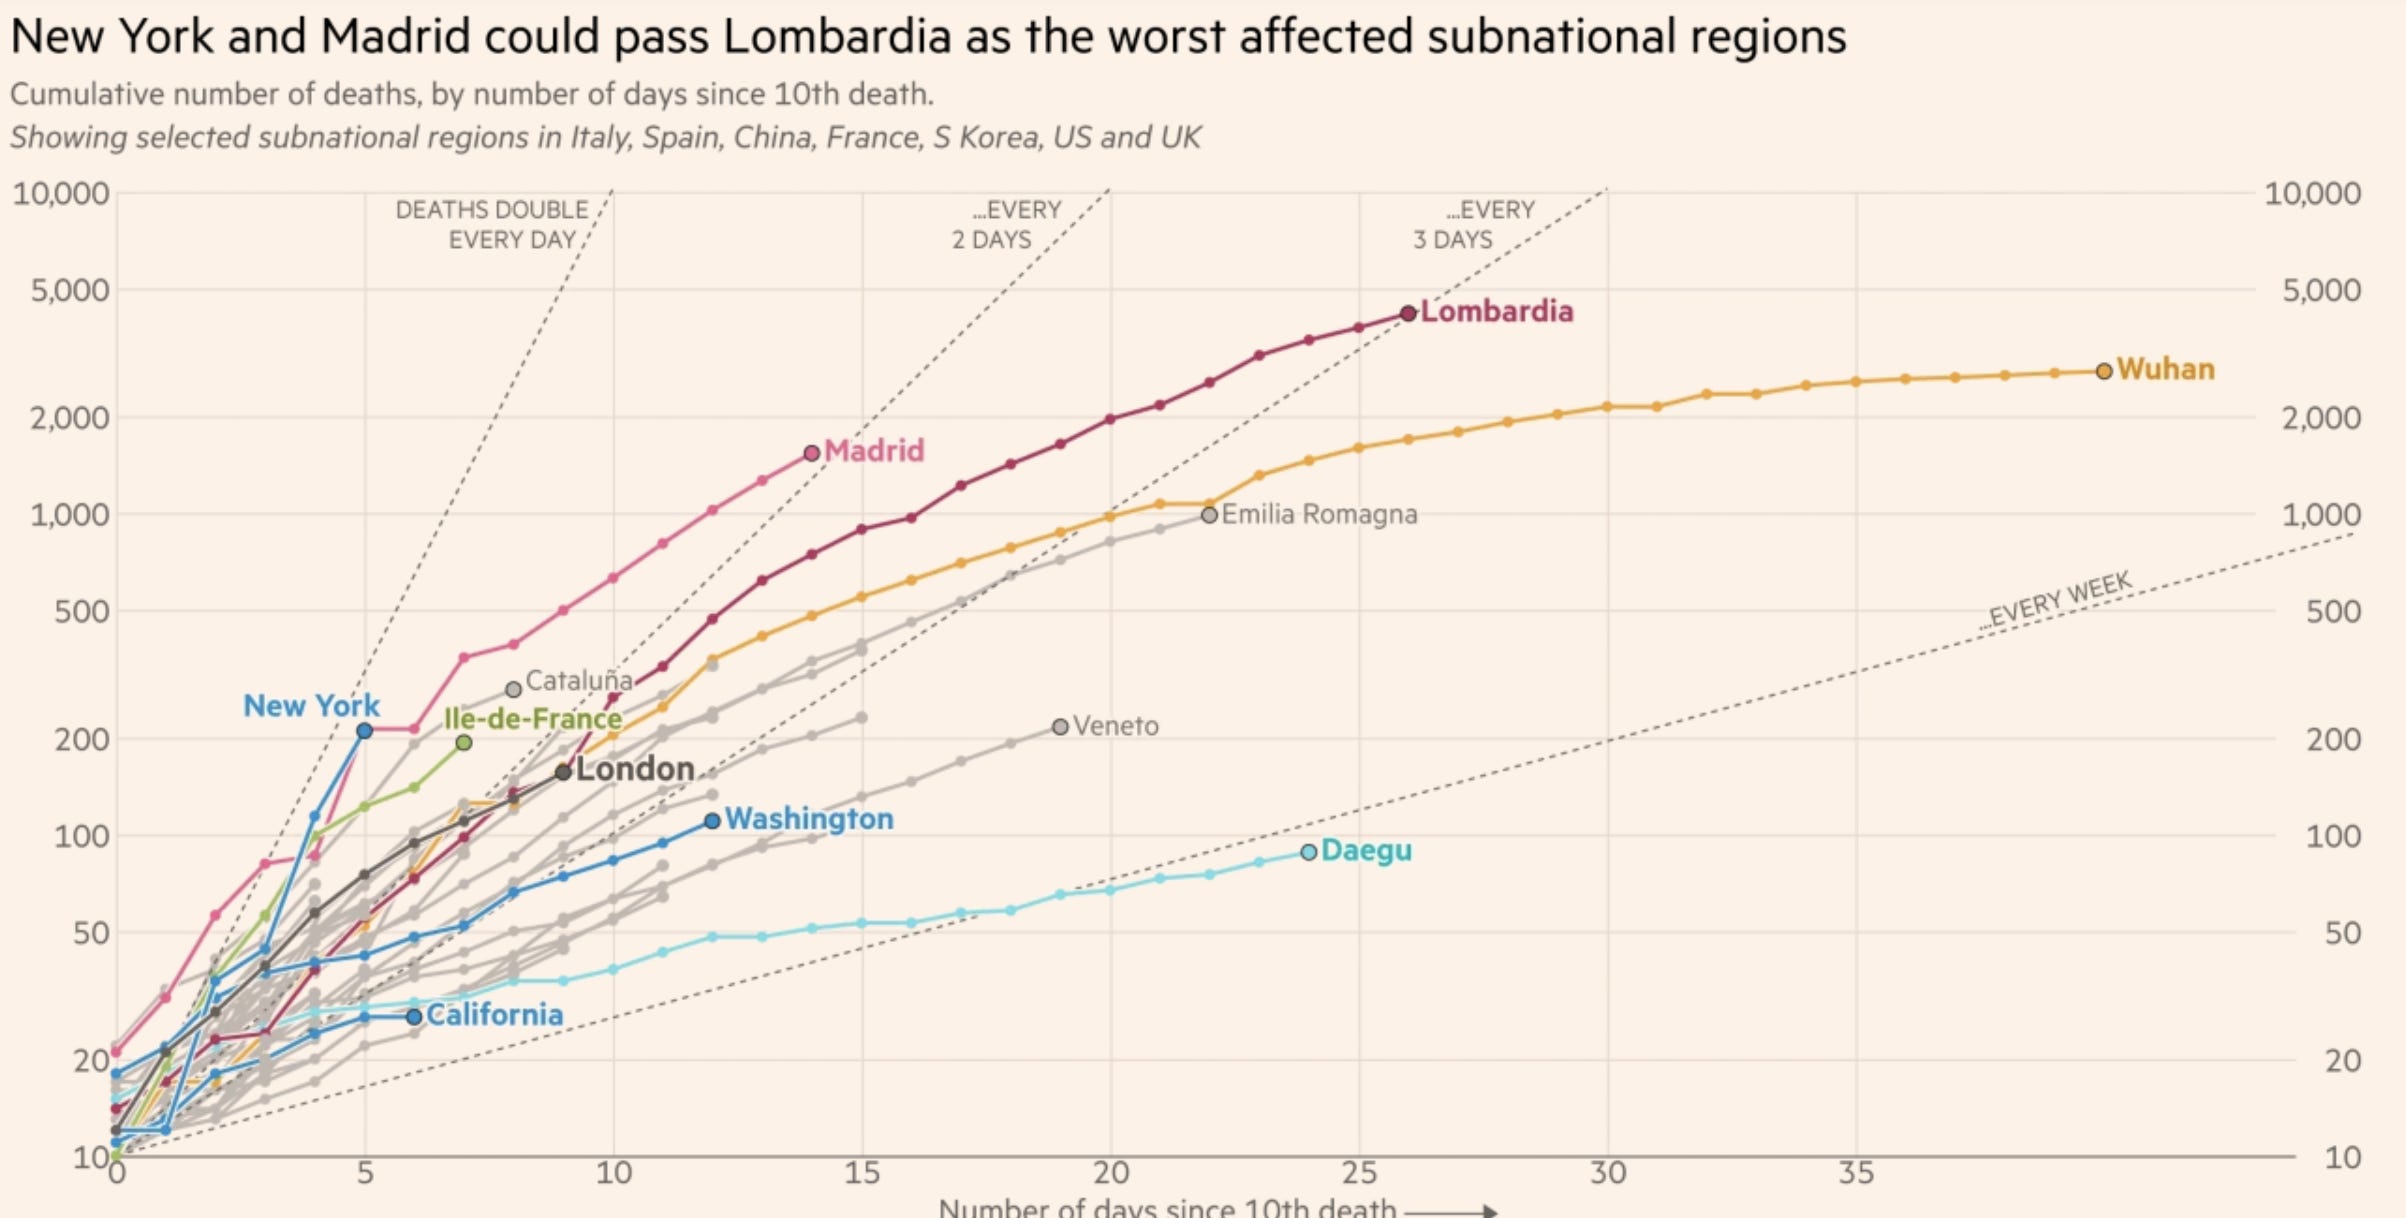
Clearly death rates and susceptibility differ dramatically between countries and regions, even between cities that are all quite dense. New York’s outbreak is not Hong Kong’s outbreak is not Madrid’s outbreak [The Financial Times]. And yet the same biological facts drive all of these wildly varied outcomes.
As you read forecasts and projections, remember that the real stuff that matters in scenarios like these can’t be modeled. The “statistical uncertainty”, which can be resolved with measurements and sample sizes, is only a tiny fraction of the massive range in potential outcomes that differentiate Daegu and New York. Most of it is down to “fundamental uncertainty”, which in turn goes back to the choices people make and values they hold.
Unfortunately we’re all going to need to live with a lot of fundamental uncertainty for the next little while. As for how long that little while is…I wish I could tell you.
Until then, stay safe!